End-of-Year Threat Intelligence Sightings Forecast
Introduction and Methodology
This report presents an analysis of Threat Intelligence (TI) Sightings aggregated from several key data sources, including social platforms, code repositories, and specialized TI feeds. The primary objective is to visually track historical trends per source and provide a short-term adaptive forecast for a defined period (in days).
For the global view (aggregating all sighting types), we applied a SARIMAX model and compared it with an Adaptive / Exponential Decay approach to highlight differing trend interpretations.
The data pipeline and analysis for source-specific sightings follow two main steps:
- Historical Trend (Weekly): Sightings are filtered by source, aggregated weekly by domain within that source (e.g., individual Fediverse instances), and visualized to show distribution and activity patterns.
- Adaptive Forecast (Daily): Total daily sightings per source are analyzed to determine the underlying trend:
- Increasing trend → fitted with a Logistic Growth model to project potential saturation points.
- Decreasing trend → fitted with an Exponential Decay model to estimate a future baseline or floor.
The next sections display historical charts (weekly aggregation by sub-domain) and predictive charts (daily total counts) for each analyzed source.
Data is available here, and the report is also available as a PDF.
Adaptive Forecast
To predict the number of sightings over time, we adaptively select the forecasting model based on the observed trend slope. This is achieved independently for each pipeline.
Exponential Decay model:
Logistic Growth model:
The implementation is available on GitHub.
Global View
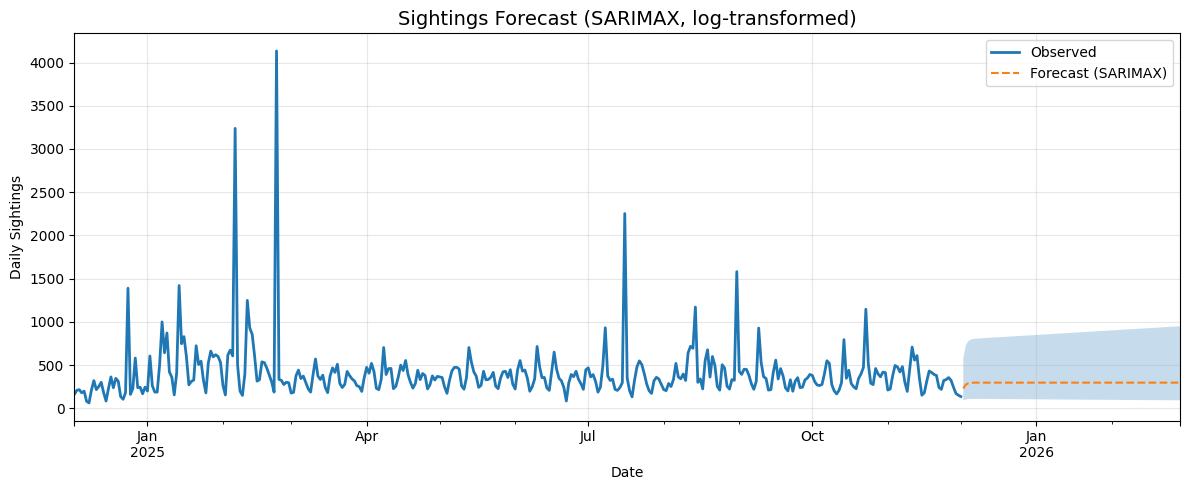
We have aggregated over 165,000 sightings since 1999-01-01; however, for the global view, we focus on the past year of data. Notably, collection volumes have grown significantly since September 2024, driven by the deployment of our various sighting tools.
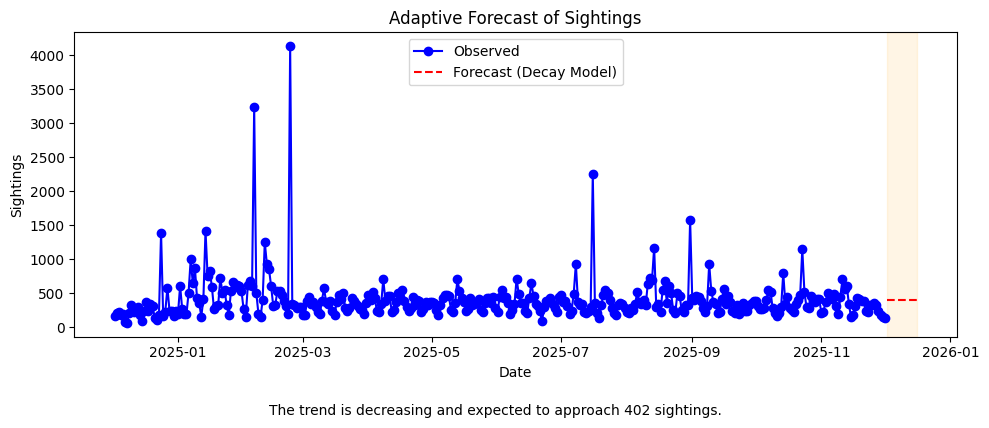
Insights:
- The SARIMAX model captures cyclical patterns in sightings and can detect emerging surges.
- The decay model emphasizes a long-term baseline, highlighting periods when activity naturally declines.
Fediverse
The Fediverse is a network of decentralized social servers (e.g., Mastodon instances). Monitoring sightings here provides early signals of community-driven threat reporting.
Historical Activity (Weekly)
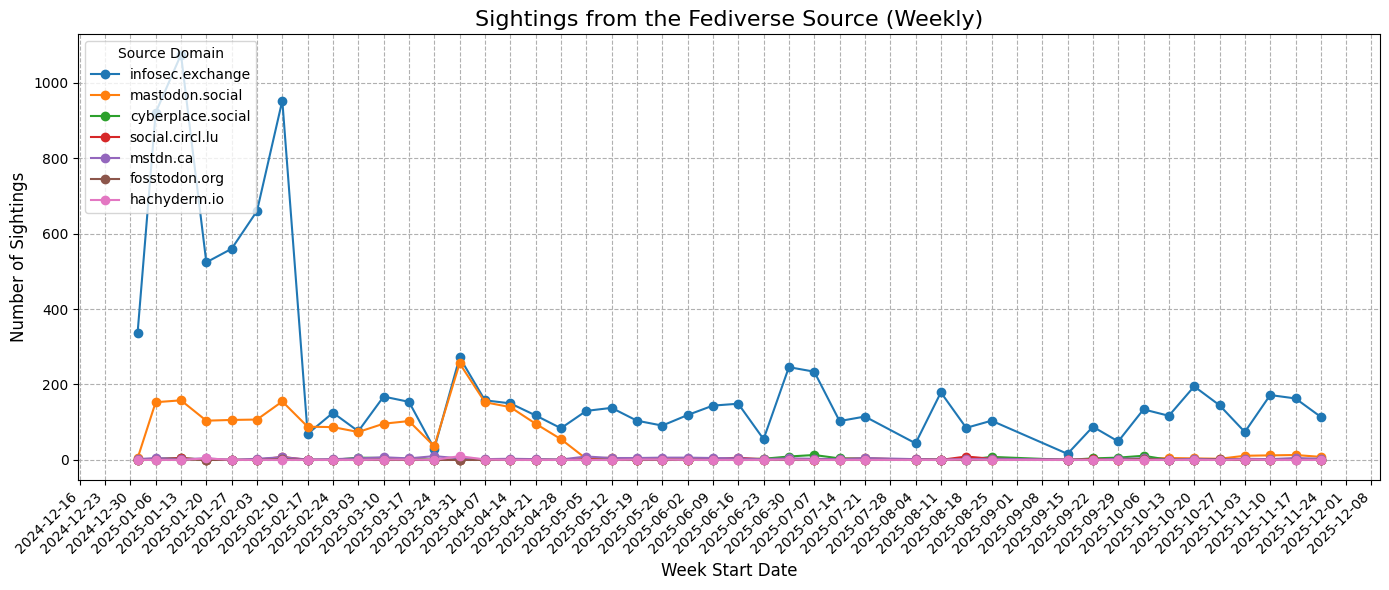
Observations:
- Peaks appear to correspond to bursts of discussion, often triggered by the vendor involved in a vulnerability or by its severity and exploitability.
- Activity varies across instances, indicating heterogeneous engagement in TI reporting.
Adaptive Forecast (Daily)

Insights:
- The forecast suggests a decreasing trend, approaching a floor near 17 sightings/day.
- Analysts can interpret this as a stabilization phase after recent high-activity events.
Bluesky
Bluesky serves as a decentralized, modern social platform for security discussions, similar to the Fediverse.
Historical Activity (Weekly)
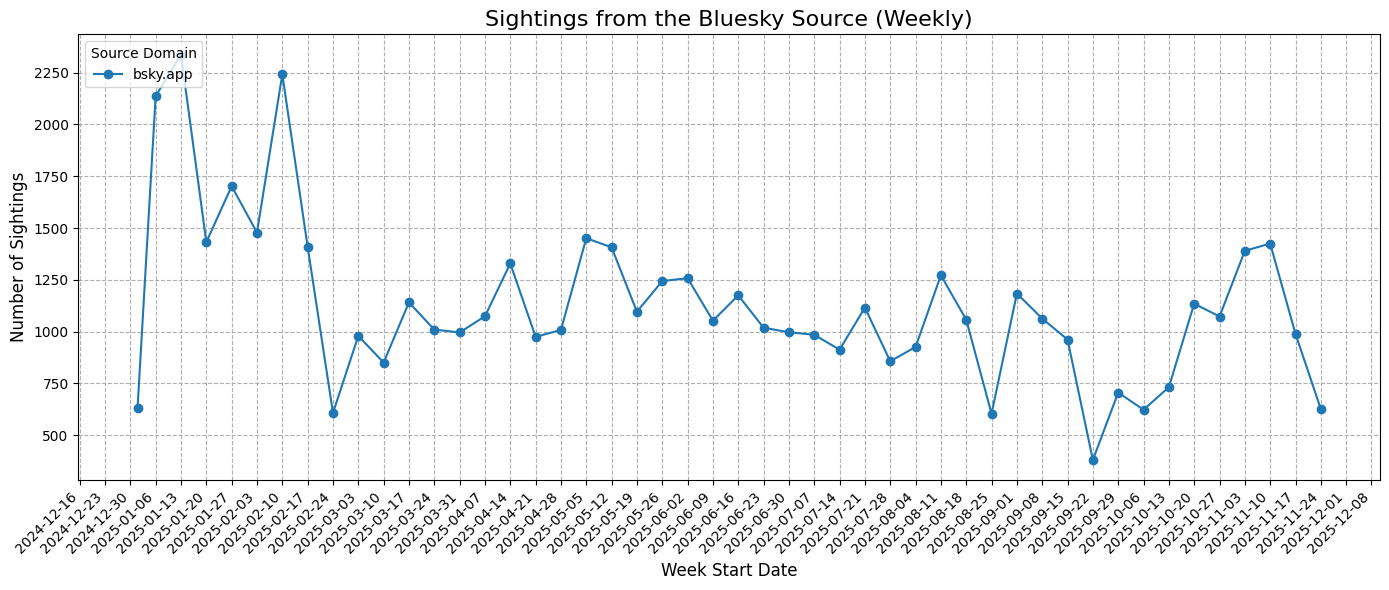
Observations:
- Weekly fluctuations mirror platform engagement cycles, including release-driven spikes in TI information.
- Consistent reporting from Bluesky suggests it is an increasingly relevant source for threat detection.
Adaptive Forecast (Daily)
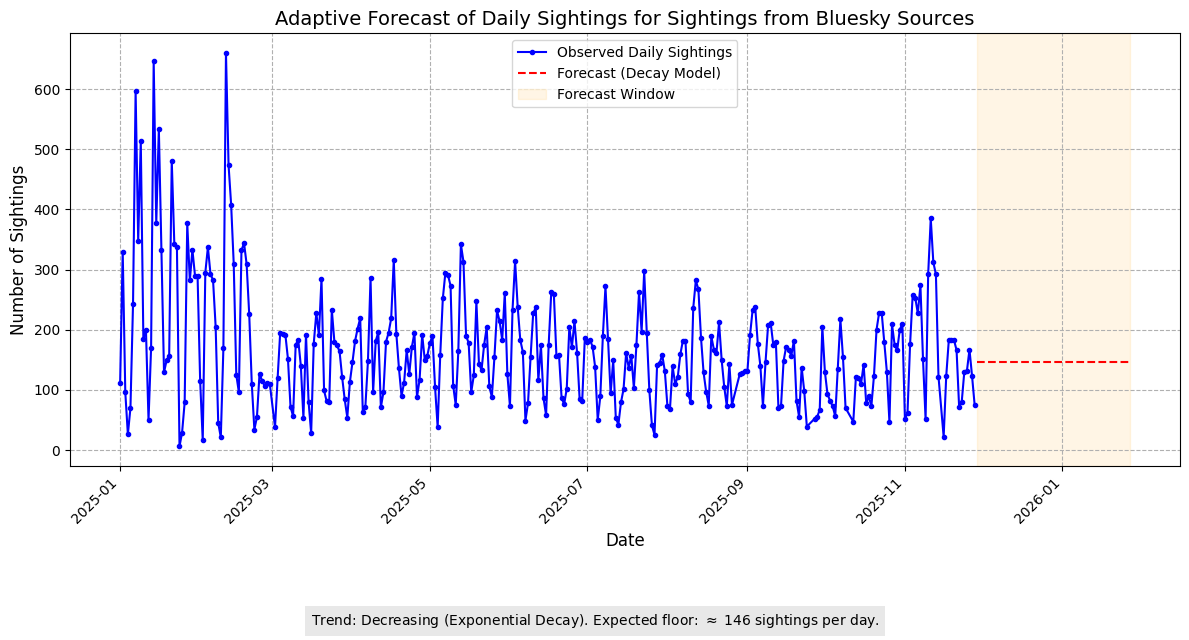
Insights:
- Slightly decreasing trend with a projected floor around 146 sightings/day.
- Sustained engagement indicates Bluesky remains a reliable source for early TI signals.
Gist
Gist is a critical source for sharing code, configuration files, PoCs, and raw threat data.
Historical Activity (Weekly)
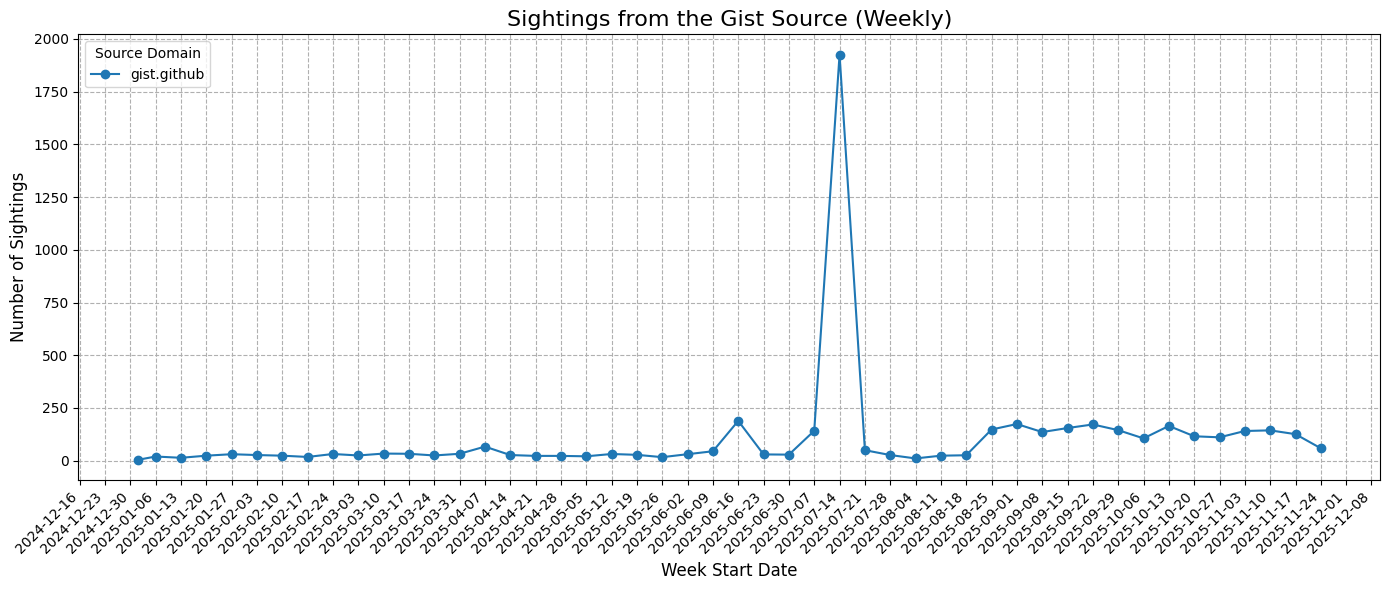
Observations:
- Sharp weekly spikes often coincide with the release of new PoCs, significant configuration dumps, or data leaks.
- Activity intensity correlates with major vulnerability announcements. Sometimes even before the availability of the CVE record.
Adaptive Forecast (Daily)
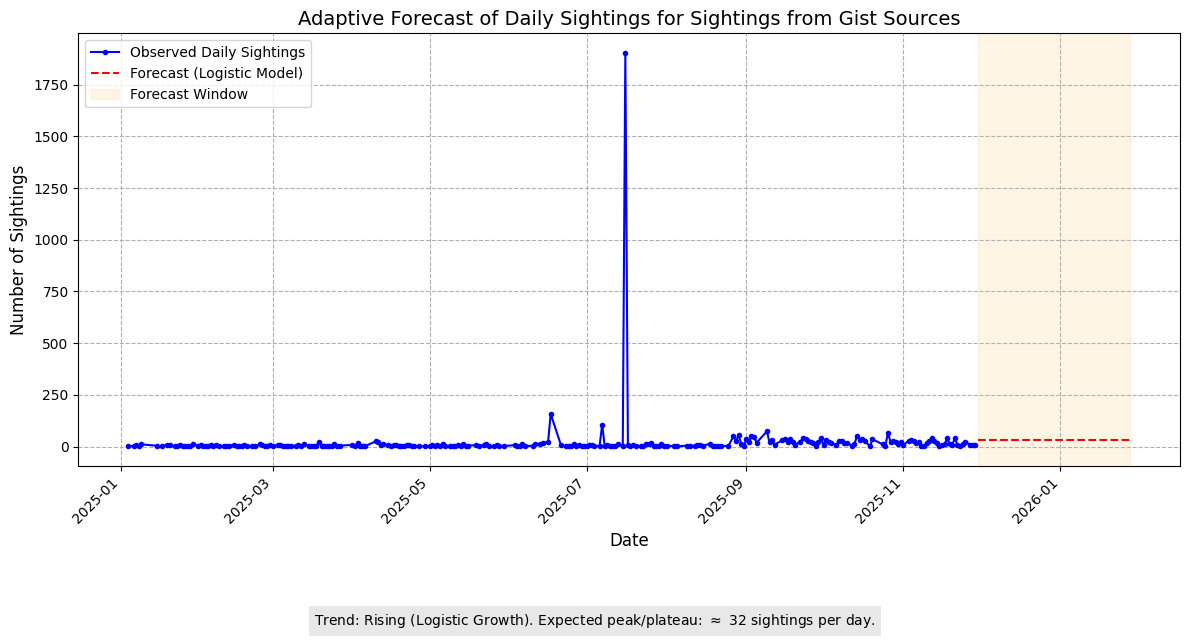
Insights:
- Forecast indicates a slightly rising trend, stabilizing around 32 sightings/day.
- Analysts can interpret this as a steady flow of early-stage threat artifacts.
MISP
MISP provides curated, high-confidence threat intelligence sightings. Although the volume of vulnerability-related observations is lower than that of social platforms, the data is more structured and consistently reliable, offering higher-quality intelligence. This is partly because the MISP dedicated sighting tool explicitly targets attributes associated with the specific vulnerability type. The sporadic nature of these sightings makes mid-term forecasting challenging, even when using adaptive methods such as SARIMAX. As such, the results should be treated with caution. We plan to improve our MISP sighting tool to identify vulnerability sightings in objects not labeled as vulnerabilities.
Historical Activity (Weekly)
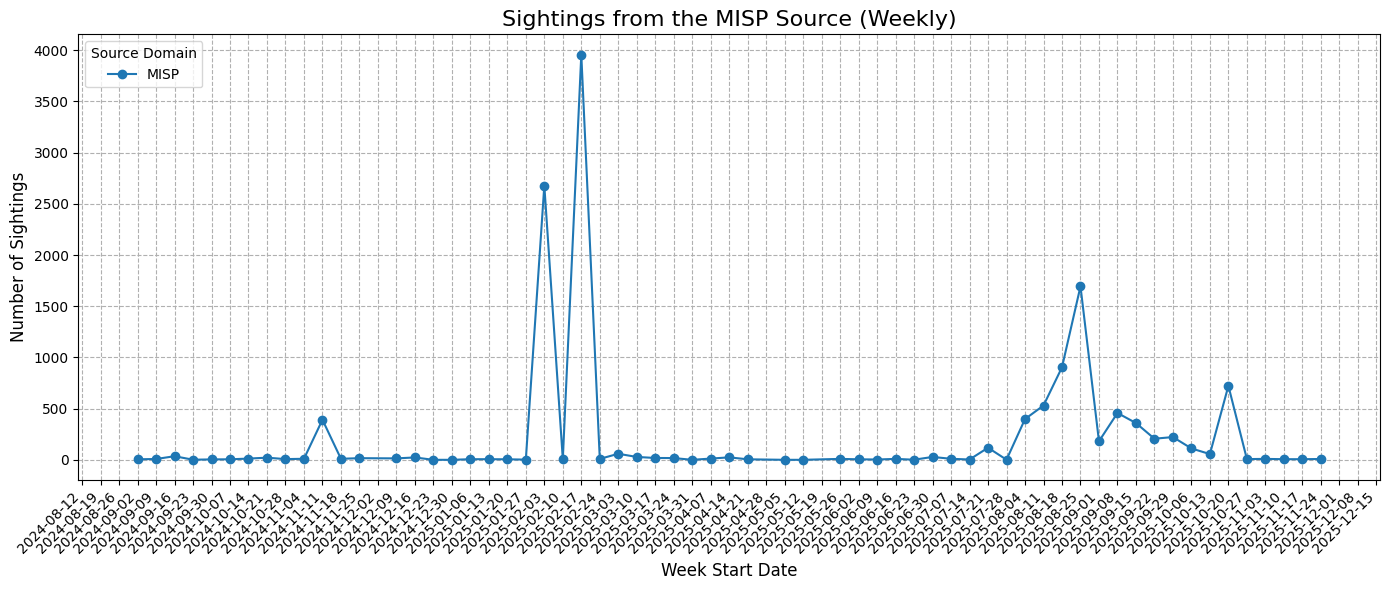
Observations:
- Weekly activity is smoother, reflecting institutional contributions and structured updates.
- Bursts in activity typically coincide with major vulnerability events, as multiple contributors across the MISP network submit sightings, highlighting coordinated focus on high-impact disclosures.
Adaptive Forecast (Daily)

Insights:
- Logistic growth model suggests rising activity, with daily sightings expected to peak near 96/day.
- Indicates increased structured intelligence input, beneficial for high-confidence threat detection.
The Shadowserver Foundation
The Shadowserver Foundation is a cornerstone resource for security researchers, providing an extensive wealth of data on real-world exploits and their associated vulnerabilities, complete with daily statistics and geographical insights.
Historical Activity (Weekly)
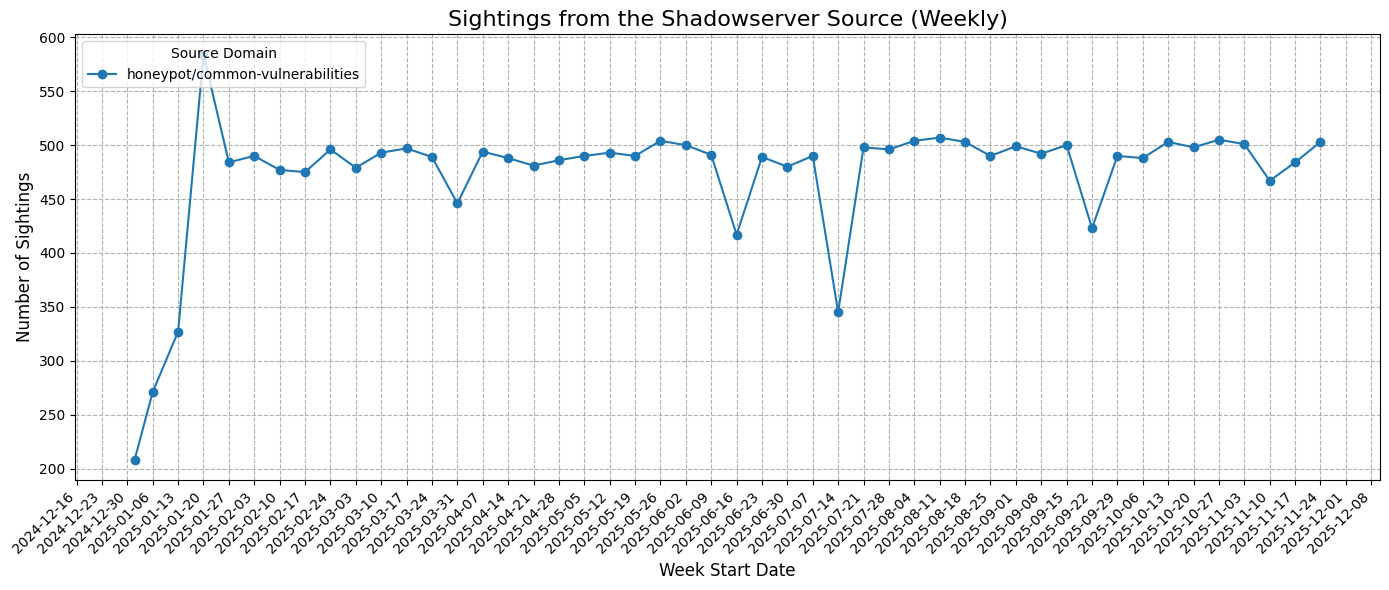
Our daily sightings from the Shadowserver Foundation are based on the honeypot group:
- Exploited vulnerabilities (type: exploited): https://vulnerability.circl.lu/sightings/?query=honeypot%2Fexploited-vulnerabilities
- Common vulnerabilities (type: seen): https://vulnerability.circl.lu/sightings/?query=honeypot%2Fcommon-vulnerabilities
Adaptive Forecast (Daily)

The volume of observations is expected to show slight growth, peaking at approximately 128/day.
Metasploit
Metasploit sightings typically reflect tool-based testing or exploitation activity.
Historical Activity (Weekly)

Observations:
- Peaks align with active exploitation campaigns or module releases, which is a good indicator of exploitability.
Adaptive Forecast (Daily)
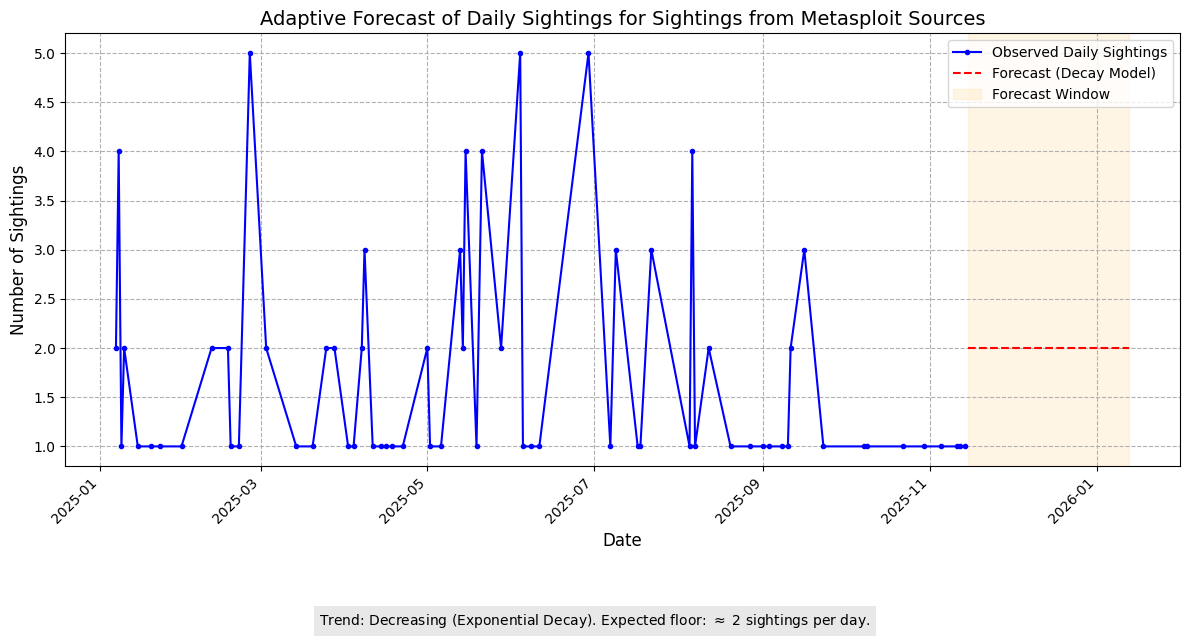
Exponential decay forecast with a floor approximately to 2/day.
Conclusion
- Social sources (Fediverse, Bluesky) display volatile, event-driven patterns, reflecting community discussions.
- Structured sources (MISP, Shadow Server, Gist) exhibit smoother, more predictable trends, providing higher-confidence intelligence.
- Forecasting models support short-term planning, allowing teams to anticipate surges (Logistic Growth) or declines (Exponential Decay) in incoming TI sightings.
- Combining multiple sources ensures a balanced situational awareness, capturing both early signals and verified intelligence.
- A potential path forward involves attributing weights to sightings according to their origin.
Key Takeaways:
- Early detection: Social platforms provide rapid but noisy signals.
- Reliability: Structured sources confirm and validate threats.
- Adaptive planning: Forecasting helps resource allocation for analysts and SOCs.
Funding

The Federated European Team for Threat Analysis (FETTA) aims to enhance Cyber Threat Intelligence (CTI) products across the EU, supporting coordinated reporting and reducing redundancy among SOCs and CSIRTs.
The Computer Incident Response Center Luxembourg (CIRCL) contributes extensive expertise in incident management, threat intelligence, and open-source cybersecurity tools, playing a pivotal role in fostering cross-European collaboration.